On this page
Introduction
Access to information under the control of Indigenous Services Canada (ISC) and Crown-Indigenous Relations and Northern Affairs Canada (CIRNAC) and their predecessors – Indian and Northern Affairs Canada (INAC) and Aboriginal Affairs and Northern Development Canada (AANDC) – has long been considered problematic and was recently identified as a concern by the Independent Special Interlocutor for Missing Children and Unmarked Graves and Burial Sites associated with Indian Residential Schools in her Progress Update Report (November 2022) and Interim Report (June 2023). The release of the Special Interlocutor’s final report had been scheduled for June 2024, but is now expected in the Fall.
Meanwhile, in a series of posts, we aim to support the efforts of the Special Interlocutor and others who are working to overcome barriers to access to information pertaining to the history and legacy of relations between First Nations and Canada.
We began by identifying statutes and regulations, policies and procedures, internal and external oversight mechanisms, and primary sources of data pertaining to ISC/CIRNAC’s access to information programs.
We next developed a framework for evaluating this sort of complaint about ISC/CIRNAC’s responsiveness: “I shouldn’t have had to wait so long to receive so little information!
Our framework draws upon a 2014 internal audit of AANDC’s handling of Access to Information (ATI) requests, that highlighted four key categories of performance:
- COST
- EFFORT
- COMPLIANCE
- EFFICIENCY
We extracted ISC- and CIRNAC-related data for 2018-19 to 2022-23 from the Treasury Board Secretariat’s (TBS’s) Annual Statistics on the Access to Information and Privacy Acts. ISC and CIRNAC commented on these data in their Annual Reports to Parliament.1Annual Reports to Parliament for ISC and CIRNAC were accessed at https://www.sac-isc.gc.ca/eng/1575132098314/1575132118001 and https://www.rcaanc-cirnac.gc.ca/eng/1575131323136/1575131374706, respectively. Finally, TBS’s annual Access to Information and Privacy Statistical Reports have summarized data on access to information programs operated by 191 government institutions,2Access to Information and Privacy Statistical Report for 2021–2022. allowing us to compare the performance of ISC and CIRNAC with other government institutions.
[top]
COST
Since November 30, 2017, ISC and CIRNAC have shared the cost of an Access to Information and Privacy Directorate (ATIP Directorate) to administer the Access to Information Act (ATIA) and the Privacy Act (PA). Fiscal 2018-19 was ISC/CIRNAC’s first full year of operation and their Annual Reports to Parliament from that time allow us to piece together how they allocated costs and human resources in this shared services environment.
Costs of operating the ATIP Directorate are direct costs; costs incurred by regional offices collecting and reviewing records relevant to Access to Information (ATI) requests are indirect costs.3Two studies have estimated these indirect costs. A 2014 audit of Aboriginal Affairs and Northern Development Canada (AANDC). The internal auditor estimated that, at a minimum, AANDC’s indirect costs represented one-quarter of total (direct plus indirect) costs for processing ATI requests. A 2022 external study considered the direct costs of operating ATIP Directorates across all federal institutions and the indirect costs incurred by Offices of Principle Interest (OPIs) in retrieving and reviewing records, and approving responses to ATI requests. These authors estimated that indirect costs represented more than half of total costs of processing ATI requests – with wages accounting for nearly all estimated indirect costs. Our analysis will deal with direct costs only.
Table 1 summarizes the direct costs and human resources allocated by ISC and CIRNAC to their shared ATIP Directorate. In their first full year of reporting under the Access to Information Act (ATIA) and Privacy Act (PA), ISC and CIRNAC split their direct costs and human resources 50:50.4Some totals included in the 2018-19 Annual Reports to Parliament were omitted in later Annual Reports. We estimated these missing values using the following equivalences in the 2018-19 Annual Report: ATIP Directorate = ISC Share of Directorate + CIRNAC Share of Directorate (row A = row B + row C); and Department Share of Directorate = ATIA Administration + PA Administration (row B = row B.1 + row B.2 and row C = row C.1 + row C.2).
| 2018-19 | 2019-20 | 2020-21 | 2021-22 | 2022-23 | |||||||
| Costs | FTEs | Costs | FTEs | Costs | FTEs | Costs | FTEs | Costs | FTEs | ||
| ISC + CIRNAC | |||||||||||
| A | ATIP Directorate | $1,603,740 | 23.000 | $1,841,301 | 23.290 | $2,234,522 | 26.094 | $3,019,643 | 21.58 | $3,008,002 | 33.76 |
| A.1 (B.1 + C.1) |
ATIA Administration | $1,284,168 | 18.400 | $1,432,727 | 18.500 | $1,841,757 | 18.904 | $2,300,203 | 15.580 | $2,309,709 | 27.232 |
| A.2 (B.2 + C.2) |
PA Administration | $319,572 | 4.600 | $408,574 | 4.780 | $496,074 | 7.190 | $719,440 | 6.000 | $698,293 | 6.528 |
| ISC | |||||||||||
| B (B.1 + B.2) |
Share of Directorate | $801,870 | 11.500 | $1,350,625 | 16.840 | $1,156,526 | 14.245 | $1,699,078 | 11.290 | $1,650,672 | 18.626 |
| B.1 | ATIA Administration | $642,084 | 9.200 | $1,000,186 | 12.770 | $810,511 | 9.677 | $1,138,761 | 7.790 | $1,135,515 | 13.617 |
| B.2 | PA Administration | $159,786 | 2.300 | $350,439 | 4.070 | $346,015 | 4.568 | $560,317 | 3.500 | $515,157 | 5.009 |
| CIRNAC | |||||||||||
| C (C.1 + C.2) |
Share of Directorate | $801,870 | 11.500 | $490,676 | 6.440 | $1,181,305 | 11.849 | $1,320,565 | 10.290 | $1,357,330 | 15.134 |
| C.1 | ATIA Administration | $642,084 | 9.200 | $432,541 | 5.730 | $1,031,246 | 9.227 | $1,161,442 | 7.790 | $1,174,194 | 13.615 |
| C.2 | PA Administration | $159,786 | 2.300 | $58,135 | 0.710 | $150,059 | 2.622 | $159,123 | 2.500 | $183,136 | 1.519 |
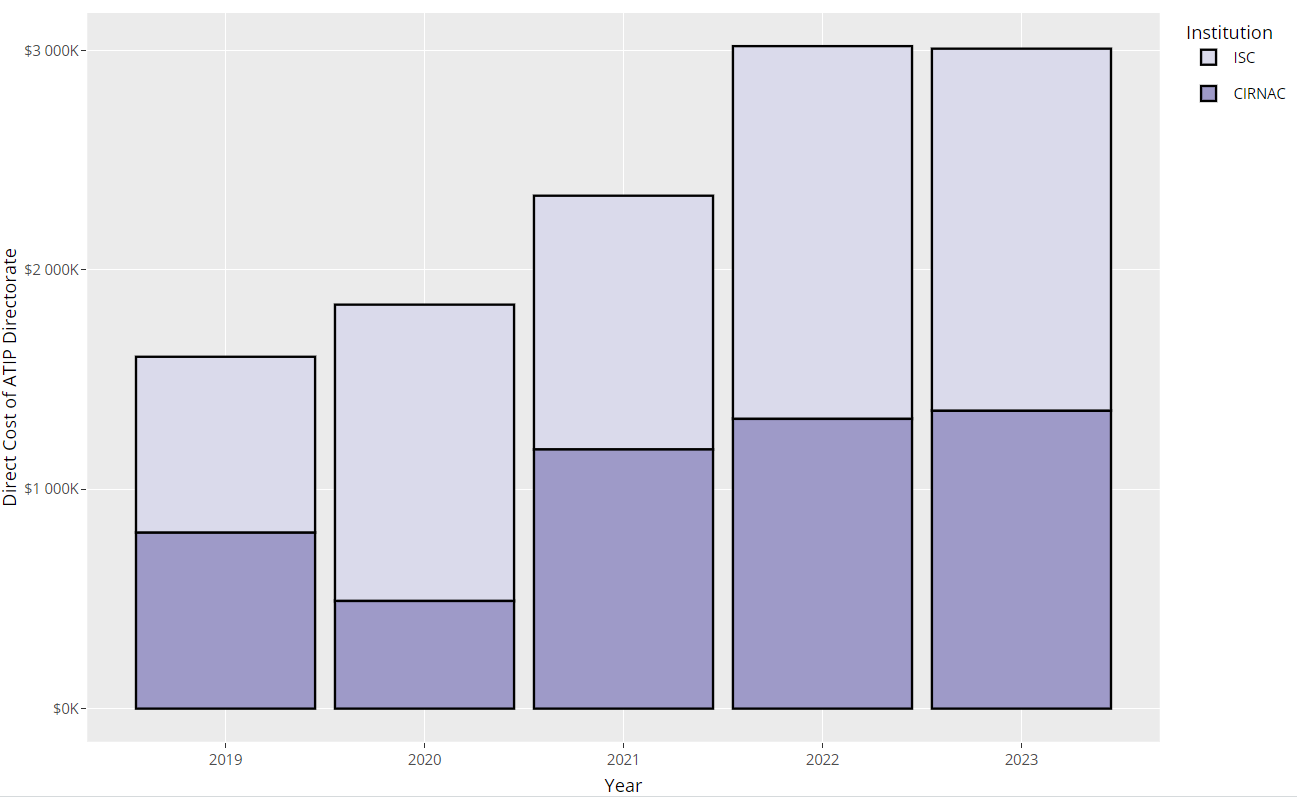
Figure 1 presents the annual direct costs allocated by ISC (row B) and CIRNAC (row C) to their shared ATIP Directorate over this period (interactive version).
CSV
RStudio
From 2018-19 to 2022-23, the annual direct costs of the Departments’ shared ATIP Directorate (row A) increased by $1,404,262 (or 88%). Annual direct costs allocated for administering the ATIA (row A.1) and PA (row A.2) increased by $1,025,541 (or 80%) and $378,721 (or 119%), respectively. ISC’s share of the direct costs (row B) increased by $555,460 (or 69%); CIRNAC’s direct costs (row C) increased by $848,802 (or 106%).5The split of annual direct costs allocated to administering the ATIA (row A.1/row A) vs Privacy Act (row A.2/ row A) ranged from 76:24 to 80:20. Split of the annual direct costs allocated to ISC (row B/row A) and CIRNAC (row C/row A) ranged from 50:50 to 73:27.
These increases in ISC/CIRNAC’s direct costs are 2 – 3 times greater than the average 40% (or $27,168,035) increase across all government institutions.6Treasury Board Secretariat of Canada, Access to Information and Privacy Statistical Report for 2022–23, Figure 8: Total direct cost of ATI program operations, 2013–14 to 2022–23. Accessed on July 15, 2024.
Table 2 itemizes the annual direct costs and human resources allocated by ISC and CIRNAC to their shared ATIP Directorate.
| 2018-19 | 2019-20 | 2020-21 | 2021-22 | 2022-23 | ||||||
| COSTS | ISC | CIRNAC | ISC | CIRNAC | ISC | CIRNAC | ISC | CIRNAC | ISC | CIRNAC |
| Salaries | $729,680 | $729,680 | $1,256,477 | $475,649 | $1,035,632 | $1,038,059 | $1,130,095 | $978,635 | $1,407,317 | $1,149,921 |
| Overtime | $1,960 | $1,960 | $13,458 | $5,351 | $43,602 | $42,358 | $28,066 | $20,780 | $83,333 | $60,017 |
| Professional services contracts | $11,190 | $11,190 | $78,420 | $7,676 | $72,344 | $88,487 | $506,570 | $284,370 | $128,893 | $128,894 |
| Other | $59,040 | $59,040 | $2,207 | $2,000 | $4,948 | $12,401 | $34,347 | $36,780 | $31,129 | $18,498 |
| Total | $801,870 | $801,870 | $1,350,625 | $490,676 | $1,156,526 | $1,181,305 | $1,699,078 | $1,320,565 | $1,650,672 | $1,431,026 |
| RESOURCES (FTEs) | ||||||||||
| Full-time employees | 11.000 | 11.000 | 14.670 | 5.720 | 13.676 | 10.775 | 9.290 | 9.290 | 16.826 | 13.338 |
| Part-time and casual employees | 0.010 | 0.000 | 0.070 | 0.220 | 0.274 | 0.274 | 0.000 | 0.000 | 0.000 | 0.000 |
| Regional staff | 0.000 | 0.000 | 0.000 | 0.000 | 0.000 | 0.000 | 0.000 | 0.000 | 1.250 | 1.250 |
| Consultants and agency personnel | 0.000 | 0.000 | 1.000 | 0.510 | 0.295 | 0.800 | 2.000 | 1.000 | 0.550 | 0.546 |
| Students | 0.500 | 0.500 | 0.100 | 0.000 | 0.000 | 0.000 | 0.000 | 0.000 | 0.000 | 0.000 |
| Total | 11.510 | 11.500 | 16.840 | 6.450 | 14.245 | 11.849 | 11.290 | 10.290 | 18.626 | 15.134 |
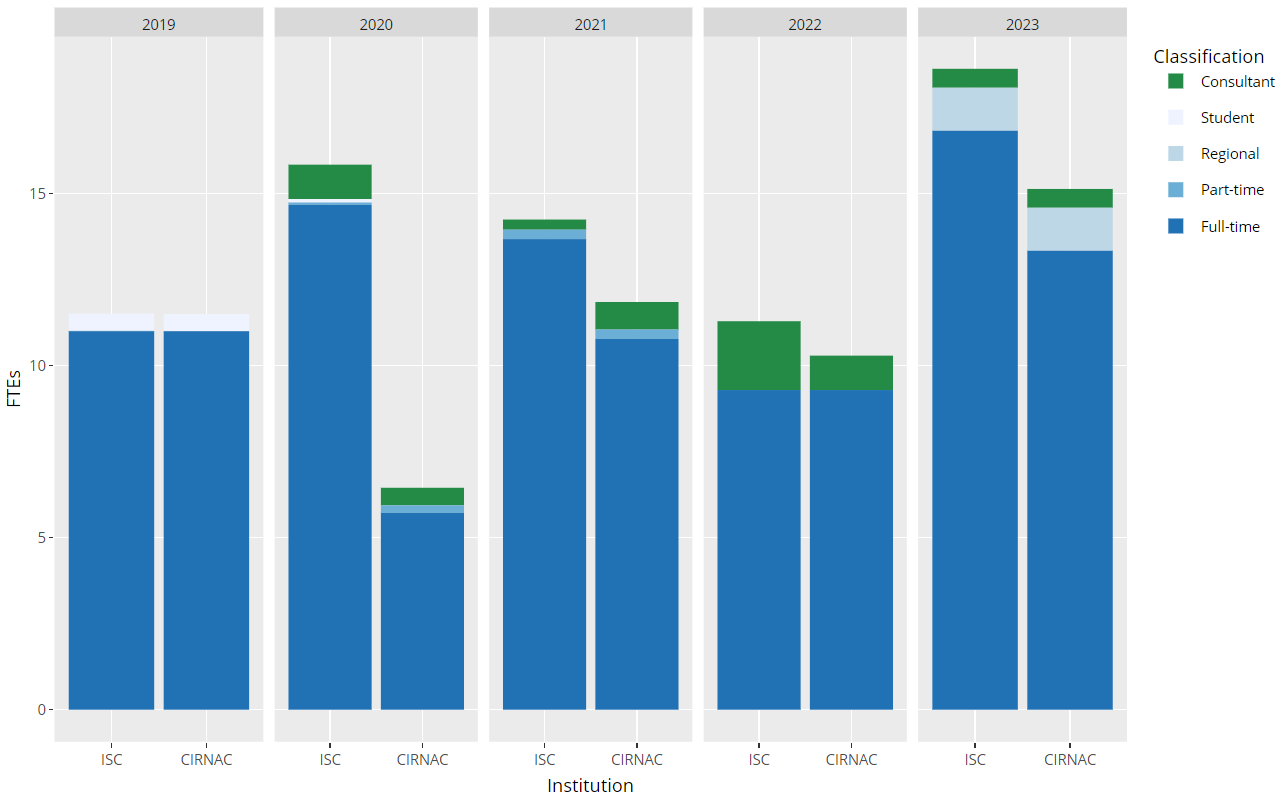
Figure 2 presents the annual FTEs by classification allocated by ISC and CIRNAC to their shared ATIP Directorate (interactive version).
CSV
RStudio
Finally, Table 3 presents the direct costs and human resources for staffing and consultants allocated by ISC and CIRNAC to their shared ATIP Directorate.7Figures are derived from Table 2 above. For staffing, costs includes salaries and overtime; FTEs include full-time, part-time, casual and regional staff and students. For consultants, costs include professional services contracts; FTEs include consultants/agency personnel.
| 2018-19 | 2019-20 | 2020-21 | 2021-22 | 2022-23 | ||||||
| STAFFING | ISC | CIRNAC | ISC | CIRNAC | ISC | CIRNAC | ISC | CIRNAC | ISC | CIRNAC |
| Cost | $731,640 | $731,640 | $1,269,935 | $481,000 | $1,079,234 | $1,080,417 | $1,158,161 | $999,415 | $1,490,650 | $1,209,938 |
| FTEs | 11.510 | 11.500 | 14.840 | 5.940 | 13.950 | 11.049 | 9.290 | 9.290 | 18.076 | 14.588 |
| Cost/FTE | $63,566 | $63,621 | $85,575 | $80,976 | $77,364 | $97,784 | $124,667 | $107,580 | $82,466 | $82,941 |
| CONSULTANTS | ||||||||||
| Cost | $11,190 | $11,190 | $78,420 | $7,676 | $72,344 | $88,487 | $506,570 | $284,370 | $128,893 | $128,894 |
| FTEs | 0.000 | 0.000 | 1.000 | 0.510 | 0.295 | 0.800 | 2.000 | 1.000 | 0.550 | 0.546 |
| Cost/FTE | — | — | $78,420 | $15,051 | $245,234 | $110,609 | $253,285 | $284,370 | $234,351 | $236,070 |
From 2018-19 to 2022-23, total annual direct costs for staffing (ISC and CIRNAC combined) increased by $1,237,308 (or 104%); total annual resources for staffing increased by 9.654 FTEs (or 42%). Compared to 2018-19, average direct cost per staffing FTE in 2022-23 increased by $19,085 (or 30%). There is no explanation for even greater increases in average direct cost per staffing FTE in 2020-21/2021-22 – increases that were rolled back in 2022-23.
Figure 3 presents the annual direct costs allocated by ISC and CIRNAC for staffing and consultants to their shared ATIP Directorate during this period (interactive version).
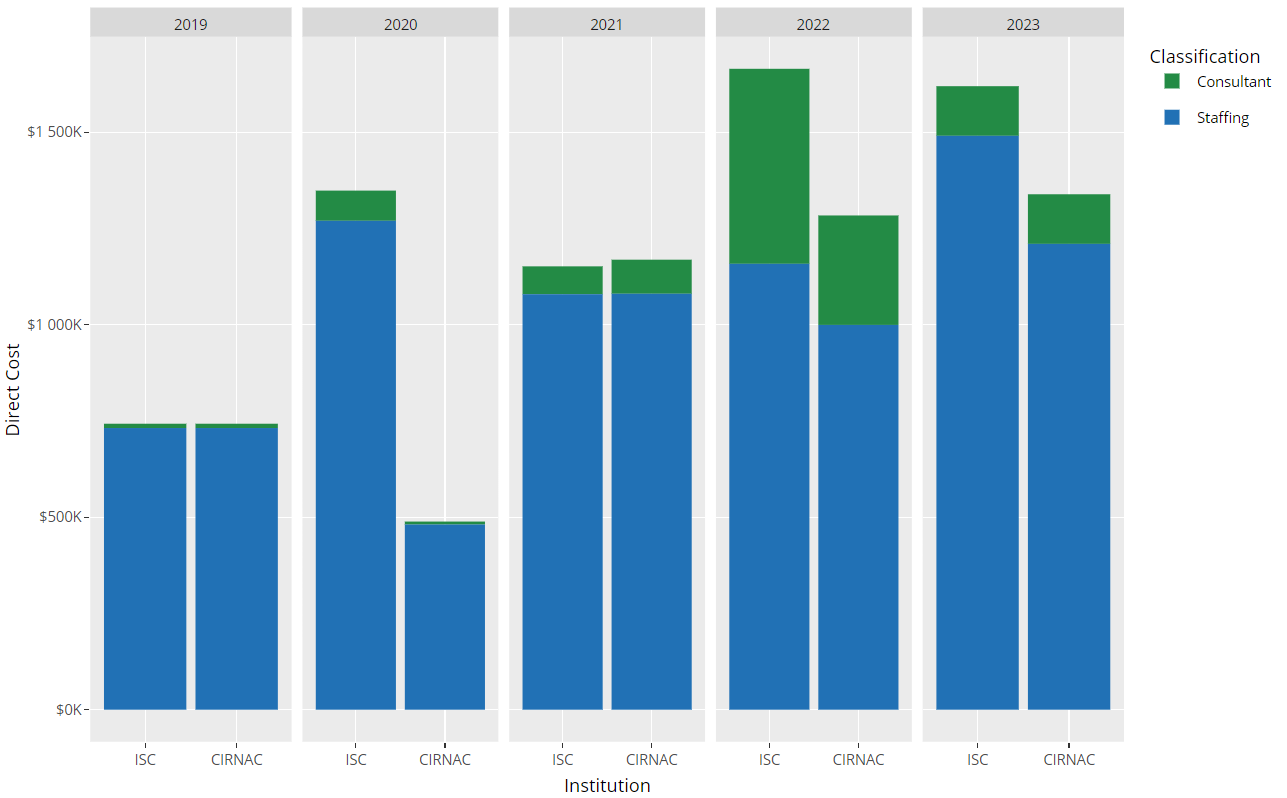
Over these five years, annual direct costs for consultants (ISC and CIRNAC combined) varied from a low of $22,380 in 2018-19 to a high of $790,940 in 2021-22. In 2021-23/2022-23, the average cost per consultant FTE was $256,037. Annual Reports from this time explain simply that consultants were hired to help in reducing backlog files.
CSV
RStudio
UPDATE:
On July 11, 2024, we submitted four ATIP requests to CIRNAC seeking records related to the use of consultants in 2019-20 to 2022-23, including:
- Calls for expressions of interest, requests for proposals, etc.
- Contracts (original and amended)
- Progress reports (interim and final).
On July 14, 2024, we submitted two ATIP requests to CIRNAC seeking records related to the remarkable increase in staffing costs in 2020-21 and 2021-22 and the rollback of these increases in 2022-23.
Conclusion
Our framework for evaluating ISC/CIRNAC’s access to information programs focuses on four categories of performance:
- COST
- EFFORT
- EFFICIENCY
- COMPLIANCE
Our analysis of COST has relied on the Treasury Board Secretariat’s Annual Statistics on the Access to Information and Privacy Acts and ISC/CIRNAC’s Annual Reports to Parliament for 2018-19 to 2022-23.
Over this period, annual direct costs of ISC/CIRNAC’s shared ATIP Directorate increased by $1,404,262 (or 88%). Annual direct costs for administering the ATIA (row A.1) and PA (row A.2) increased by $1,025,541 (or 80%) and $378,721 (or 119%), respectively. These increases were 2 – 3 times greater than an average 40% increase across all government institutions. These increases largely reflected costs for staffing and consultants. ISC/CIRNAC’s total annual direct costs for staffing increased by $1,237,308 (or 104%); total annual resources for staffing increased by 9.654 FTEs (or 42%). Compared to 2018-19, ISC/CIRNAC’s average cost per FTE had increased by $19,085 (or 30%) in 2022-23 . Even greater increases in average cost per FTE were reported in 2020-21/2021-22 – and then rolled back in 2022-23.
ISC/CIRNAC’s total annual costs for consultants varied from $22,380 in 2018-19 to $790,940 in 2021-22. In 2021-23/2022-23, the average cost per consultant FTE was $256,037. Annual Reports to Parliament from this time explain simply that consultants were hired to help reduce backlog files.
We have asked CIRNAC for records that might explain temporary spikes in the average cost per staffing FTE in 2021-22/2022-23 and the use of highly-paid consultants to process ATIP requests during this period.
[top]
Licence
We are publishing this material under a Creative Commons Attribution-NonCommercial-ShareAlike 4.0 International licence. If you find use for our work, please credit Paul Allen (https://paulallen.ca).

[top]