On this page
Introduction
Access to information under the control of Indigenous Services Canada (ISC) and Crown-Indigenous Relations and Northern Affairs Canada (CIRNAC) and its predecessors – Indian and Northern Affairs Canada (INAC) and Aboriginal Affairs and Northern Development Canada (AANDC) – has long been considered problematic and was recently identified as a concern by the Independent Special Interlocutor for Missing Children and Unmarked Graves and Burial Sites associated with Indian Residential Schools in her Progress Update Report (November 2022) and Interim Report (June 2023). The release of the Special Interlocutor’s final report had been scheduled for June 2024, but is now expected in the Fall.
Meanwhile, in a series of posts, we aim to support the efforts of the Special Interlocutor and others who are working to overcome barriers to access to information pertaining to the history and legacy of relations between First Nations and Canada.
Our plan for evaluating ISC/CIRNAC’s administration of the Access to Information Act (ATIA) focuses on four categories of performance that were highlighted in a 2014 internal audit of AANDC:1“With the ATIP Directorate’s recent focus on ensuring compliance with legislation and policy requirements, there has been limited focus identifying and addressing opportunities to drive efficiencies within management of ATIP requests across the entire Department. … As part of the analysis on the efficiency and continuous improvement, the audit first attempted to gain an understanding of the true cost of processing ATIP requests to the Department. While volumetric data related to ATIP requests was readily available (e.g. number of requests and number of pages) as were operating costs directly associated with the ATIP Directorate, the current data tracking and collection practices in the Department for ATIP requests was found to be insufficient to support the calculation of an accurate level of effort, or cost estimate, as not all inputs to the request process are currently tracked. As such, the audit team undertook an independent exercise to approximate this cost for the most recently completed fiscal year, 2013-2014.” Pp. 17-18. Emphasis mine.
- COST
- EFFORT
- COMPLIANCE
- EFFICIENCY
Our plan will ultimately incorporate the government’s latest set of Key Performance Indicators (KPIs) and Key Data Points (KDPs), plus other statistics from ISC/CIRNAC’s Annual Statistical Reports and Annual Reports to Parliament.
The government’s KPIs and KDPs include a single measure of COST – the Total cost of ATI program operations – where “total cost” includes an institution’s direct costs of operating its ATIP Directorate but none of the indirect costs incurred by its regional/other offices processing records that might be relevant to Access to Information (ATI) requests: “Cost of operations includes salaries, overtime, goods and services, contracts, and all other expenses specific to access to information and privacy offices. Cost of operations does not include costs associated with time spent by business areas searching for and reviewing records.”2Table 1: Table 1: fees and costs of Access to Information Act operations, 2021–22, Access to Information and Privacy Statistical Report for 2021-22).
In a previous post, we analyzed the COST of ISC/CIRNAC’s access to information programs between 2018-19 and 2022-23. Over this period, the annual direct costs of ISC/CIRNAC’s shared ATIP Directorate increased by $1,404,262 (or 88%). Annual direct costs for administering the Access to Information Act and Privacy Act increased by $1,025,541 (or 80%) and $378,721 (or 119%), respectively. These increases were 2 – 3 times greater than an average 40% increase across all government institutions over the same period.
We refine this analysis here by evaluating ISC/CIRNAC’s COST in light of two measures of their EFFORT – the Number of requests closed and the Number of pages processed for closed requests – included among the government’s KPIs and KDPs. We derive two measures of EFFICIENCYi from the ratio EFFORTi-to-COST (Table 1).
| Evaluation Component | ID | Statistic |
| COST | KDP-1 | Direct cost of ATI program operations |
| EFFORT |
KDP-3 | Number of requests closed |
| KDP-6 | Number of pages processed for closed requests | |
| EFFICIENCY |
KDP-1 / KDP-3 | Direct cost of ATI program operations / Number of requests closed |
| KDP-1 / KDP-6 | Direct cost of ATI program operations / Number of pages processed for closed requests |
[top]
EFFICIENCY
Background
Direct costs per request closed and Direct costs per page processed for request closed were included as measures of EFFICIENCY in a 2014 internal audit of AANDC and, until a few years ago, in the Treasury Board Secretariat’s Annual Statistical Reports.3For example, see Treasury Board Secretariat Annual Statistical Report for 2019-20, Table 18: Fees and costs of Access to Information Act operations.
Data sources
Neither ISC/CIRNAC’s Annual Reports to Parliament nor TBS’s current Access to Information and Privacy Statistical Reports for 2018-19 to 2022-23 included Average direct costs per closed request or Average direct costs per page processed for closed requests, but we can calculate their values from other data:
- For ISC/CIRNAC, their Annual Reports to Parliament included:
- Direct costs of ATI program operations
- Number of closed requests
- Number of pages processed for closed requests.
- For All government institutions (*including* ISC and CIRNAC), TBS’s Access to Information and Privacy Statistical Reports also included:
- Direct costs of ATI program operations
- Number of closed requests
- Number of pages processed for closed requests.4For 2018-19 to 2021-22, these data were sourced from Treasury Board Secretariat, Access to Information and Privacy Statistical Report for 2021–2022. For 2022-23, these data were sourced from Treasury Board Secretariat, Access to Information and Privacy Statistical Report for 2022–23. We should also note that, during this period, TBS’s Statistical Reports excluded Immigration, Refugees and Citizenship Canada.
- For Other government institutions (*excluding* ISC and CIRNAC), we subtract the values in #1 from their corresponding values in #2, to derive:
- Direct costs of ATI program operations
- Number of closed requests
- Number of pages processed for closed requests.
- For ISC/CIRNAC:
- Average direct costs per closed request is calculated by dividing the values in #1.1 by the values in #1.2
- Average direct costs per page processed for closed requests are calculated by dividing the values in 1.1 by the values in #1.3.
- For Other government institutions:
- Average direct costs per closed request simply is calculated by dividing the value in #3.1 by the value in #3.2
- Average direct costs per page processed for closed requests is calculated by dividing the value in #3.1 by the value in #3.3.
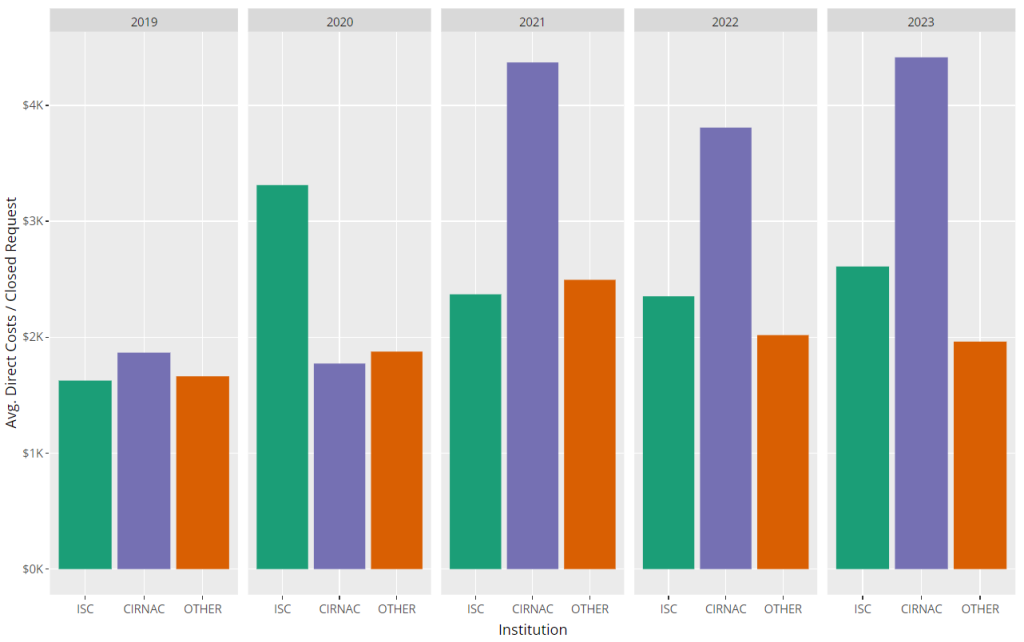
Average direct costs per closed request
Table 2 and Figure 1 (interactive version) present the Average direct costs per closed request for ISC/CIRNAC (from #4.1 above) and Other government institutions (from #5.1 above) between 2018-19 and 2022-23.
| 2018-19 | 2019-20 | 2020-21 | 2021-22 | 2022-23 | |||||||||||
| OTHER | ISC | CIRNAC | OTHER | ISC | CIRNAC | OTHER | ISC | CIRNAC | OTHER | ISC | CIRNAC | OTHER | ISC | CIRNAC | |
| Direct costs [KDP-1] |
$67,241,842 | $642,084 | $642,084 | $70,231,756 | $1,000,186 | $432,541 | $75,881,359 | $810,511 | $1,031,246 | $80,901,941 | $1,138,761 | $1,161,442 | $93,384,336 | $1,135,515 | $1,174,194 |
| Closed requests [KDP-3] |
40,426 | 395 | 344 | 37,431 | 302 | 244 | 30,411 | 342 | 236 | 40,100 | 484 | 305 | 47,607 | 435 | 266 |
| Direct costs per closed closed | $1,663 | $1,626 | $1,867 | $1,876 | $3,312 | $1,773 | $2,495 | $2,370 | $4,370 | $2,018 | $2,353 | $3,808 | $1,962 | $2,610 | $4,414 |
CSV
RStudio
Over this time, the Average direct costs per closed request for Other government institutions increased by $298 (17.9%). The same costs for ISC and CIRNAC increased by $985 (60.6%) and $2,548 (136.5%), respectively – or 3.4 and 7.6 times greater than for Other government institutions.
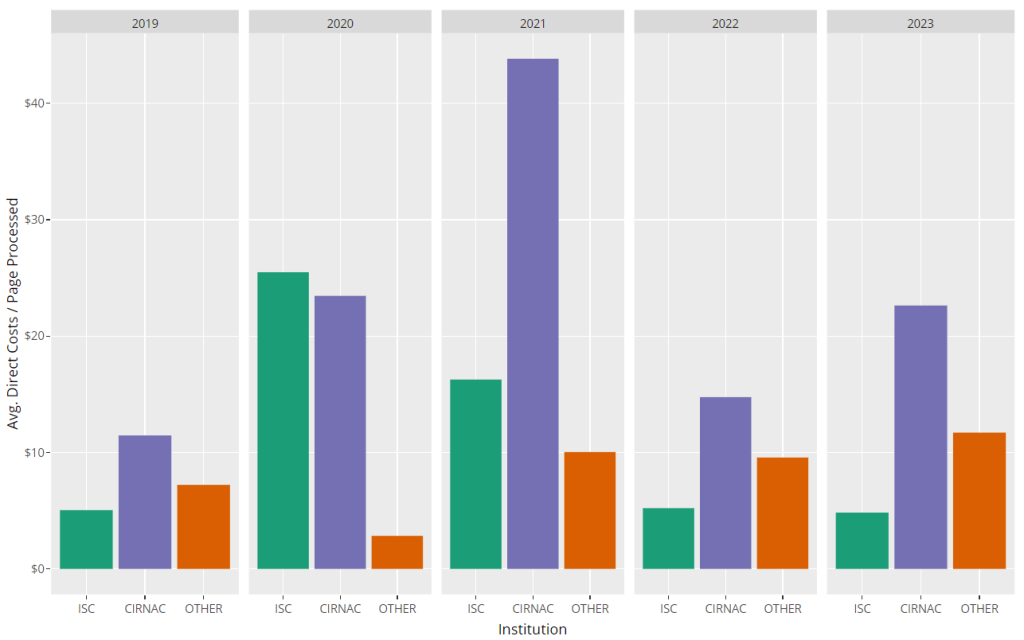
Average direct costs per page processed for closed requests
Average direct costs per page processed for closed requests was also used to measure EFFICIENCY in a 2014 internal audit of AANDC and, until a few years ago, in the Treasury Board Secretariat’s annual Access to Information and Privacy Statistical Reports covering all government institutions.5For example, see Treasury Board Secretariat, Access to Information and Privacy Statistical Report for 2019-20, Table 18: Fees and costs of Access to Information Act operations.
Table 3 and Figure 2 (interactive version) present the Average direct costs per page processed for closed requests for ISC/CIRNAC (from #4.2 above) and Other government institutions (from #5.2 above) between 2018-19 and 2022-23.
| 2018-19 | 2019-20 | 2020-21 | 2021-22 | 2022-23 | |||||||||||
| OTHER | ISC | CIRNAC | OTHER | ISC | CIRNAC | OTHER | ISC | CIRNAC | OTHER | ISC | CIRNAC | OTHER | ISC | CIRNAC | |
| Direct costs [KDP-1] |
$67,241,842 | $642,084 | $642,084 | $70,231,756 | $1,000,186 | $432,541 | $75,881,359 | $810,511 | $1,031,246 | $80,901,941 | $1,138,761 | $1,161,442 | $93,384,336 | $1,135,515 | $1,174,194 |
| Pages processed [KDP-6] |
9,311,562 | 127,078 | 55,967 | 24,754,873 | 39,245 | 18,436 | 7,555,528 | 49,811 | 23,529 | 8,455,785 | 218,173 | 78,694 | 7,974,362 | 234,722 | 51,887 |
| Direct costs per processed page | $7.22 | $5.05 | $11.47 | $2.84 | $25.49 | $23.46 | $10.04 | $16.27 | $43.83 | $9.57 | $5.22 | $14.76 | $11.71 | $4.84 | $22.63 |
CSV
RStudio
Over this time, the Average direct costs per page processed for closed requests for Other government institutions increased by $4.49 (62.2%). The same costs for ISC fluctuated considerably, but actually decreased (by -$0.21 or -4.2%). The same costs for CIRNAC also fluctuated, but increased by $11.16 (97.3%) – or 2.5 times greater than the increase for Other government institutions.
Conclusion
In a previous post, we analyzed the COST of ISC/CIRNAC’s access to information programs between 2018-19 and 2022-23. Over this period, the annual direct costs of ISC/CIRNAC’s shared ATIP Directorate increased by $1,404,262 (or 88%). Annual direct costs for administering the Access to Information Act and Privacy Act increased by $1,025,541 (or 80%) and $378,721 (or 119%), respectively. These increases were 2 – 3 times greater than an average 40% increase across all government institutions over the same period.
We refined this analysis here by evaluating ISC/CIRNAC’s COST in light of two measures of their EFFORT – the Number of requests closed and the Number of pages processed for closed requests – included among the government’s KPIs and KDPs. We derived two measures of EFFICIENCYi from the ratio EFFORTi-to-COST.
Between 2018-19 and 2022-23, the Average direct costs per closed request for ISC and CIRNAC increased by $985 (60.6%) and $2,548 (136.5%), respectively – or 3.4 and 7.6 times greater than the increase for Other government institutions. Over the same period, the Average direct costs per page processed for closed requests for ISC decreased slightly (by -$0.21 or -4.2%), while the same costs for CIRNAC increased by $11.16 (97.3%) – or 2.5 times greater than the increase for Other government institutions.
[top]
Licence
We are publishing this material under a Creative Commons Attribution-NonCommercial-ShareAlike 4.0 International licence. If you find use for our work, please credit Paul Allen (https://paulallen.ca).

[top]